Trading Accounts
Trading Conditions
Financials
CFD Trading instruments

Don’t waste your time – keep track of how NFP affects the US dollar!
The ASIC policy prohibits us from providing services to clients in your region. Are you already registered with FBS and want to continue working in your Personal area?
Personal areaWhat will happen?
Brent's price fell after a less than expected oil crude inventories report. Usually, the less expected report pushes the price higher, but this time everything went the opposite way.
It might be the signal of investors’ growing concerns about the OPEC+ upcoming conference, where oil global supply might be increased. Earlier, the CEO of Saudi Aramco called for a supply increase, since global oil inventories decrease too fast. From his point of view, if OPEC+ will not change its policy, it might lead to the continuation of the global energy crisis. In this case, XBR/USD will explode and reach $100 shortly.
Technical analysis
4H chart

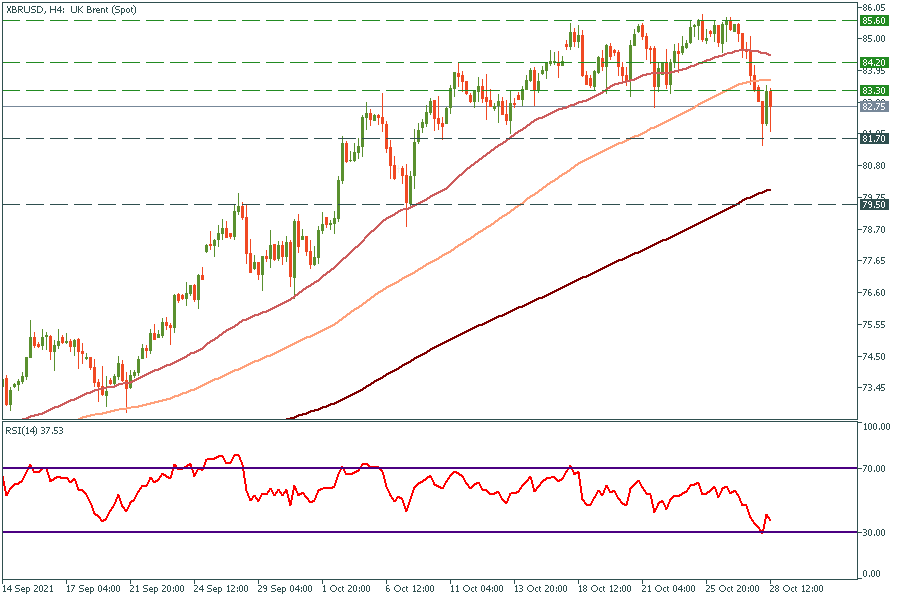
On the 4H chart, Brent fell under the 100-period moving average. At the moment it is consolidating between $81.7 and $83.3. Locally, it looks oversold according to the RSI, that’s why we can see a pullback up to $84.2 first. The main resistance will be the 50-period moving average, which has been holding the price since the middle of September 2021. If XBR/USD breaks through this resistance, it might rise as high as $85,6 again. Otherwise, if it gets rejected, it will be another proof of a downtrend beginning. The main targets for the down movement are $81.7 and $79.5.
Weekly chart

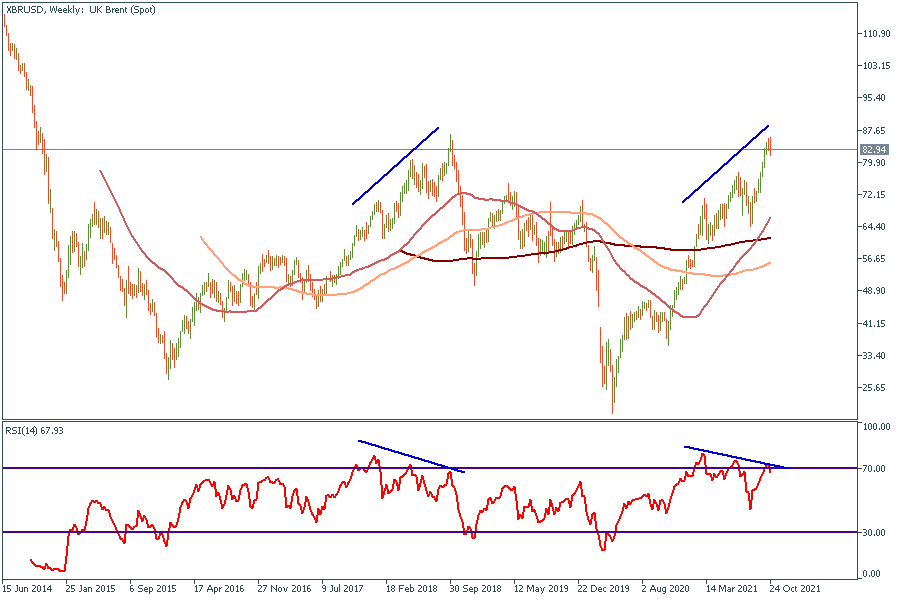
On the weekly chart, the situation which happens in 2018 repeats. The price drew 3 highs with the RSI divergence just as it did in the previous time. Later, after that pattern appeared, the price has been falling for 7 weeks straight. OPEC+ conference on August 4 will answer the question: “can technical analysis predict the future?”